When ClearSCADA 2017 was released it came with a great new feature, native in-app support for mapping and Geo-location. It is a really neat feature and if you can input locations for all your assets you can do some really interesting workflows. ViewX, WebX and CS Mobile can all publish user location information to the ClearSCADA server so you can put your operator locations together with your asset locations.
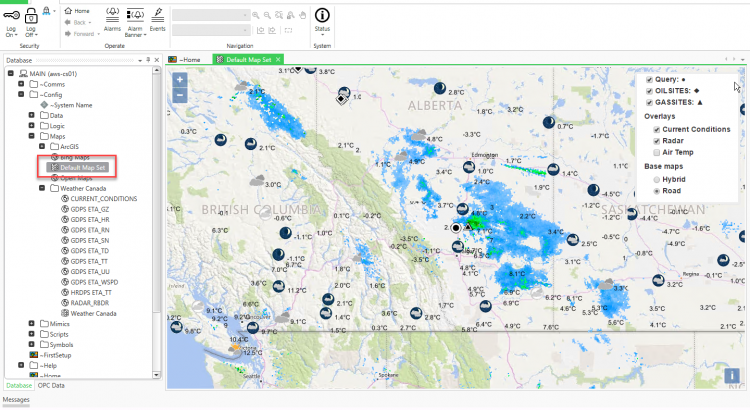
I decided to take some time a few weekends ago to see if I could get the mapping feature to pull in weather Canada data. And I managed to get it! Here are some tips and tricks for integrating Weather Canada WMS maps into ClearSCADA.
A few things before we get too deep. GIS requires a few specific objects to bring everything together.
Map Source – These objects include links out to external map sources. Could be OpenStreetMaps, Bing (if you have an API key), ArcGIS, or WMS maps. The map source is what pulls in the underlying map images. Map sources can be specified as overlays or base maps which makes layering them easier.
User Query – A user query is an object that stores a static SQL query. These objects were added when the mobile app was added to ClearSCADA. If your query holds geo-location information in columns the records in the query can be plotted on the map.
Region – The region object is essentially a shape file in the GeoJSON format. These are used to block out areas (regions) that contain assets you want to monitor. Using regions alarms can be directed to operators inside a region giving SCADA some smarts in directing alarm notifications to the right person. Regions can also be used to ensure that geographical barriers (rivers, mountains) are taken into account when determining the correct user to notify (don’t send a notification to the ‘closest’ operator if they are across the river and actually have to travel further to find a bridge than the next closest operator who might be on the right side of the river).
Map Set – A map set is a collection of map sources and user queries. This object brings it all together and allows us to use a base map, overlay some interesting data, and plot assets on the resulting map.
Setup the System for Maps
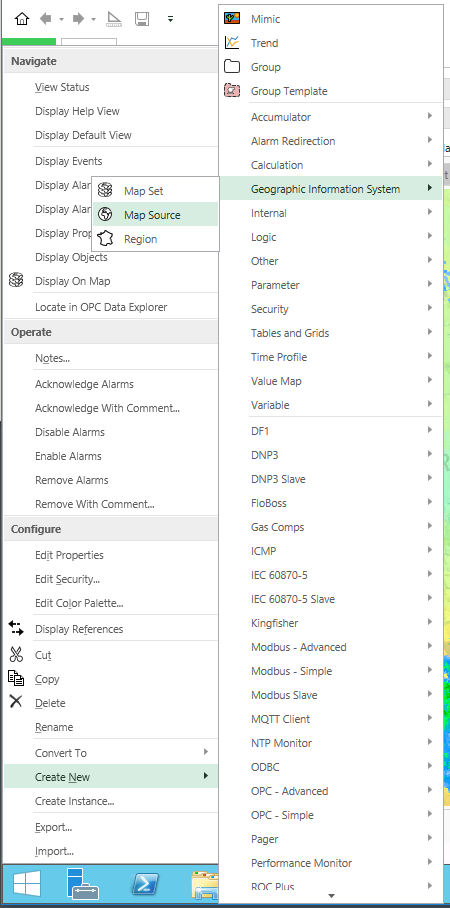
- Start by adding a map source. The easiest to add is OpenMap source since it doesn’t require an API key or anything special.
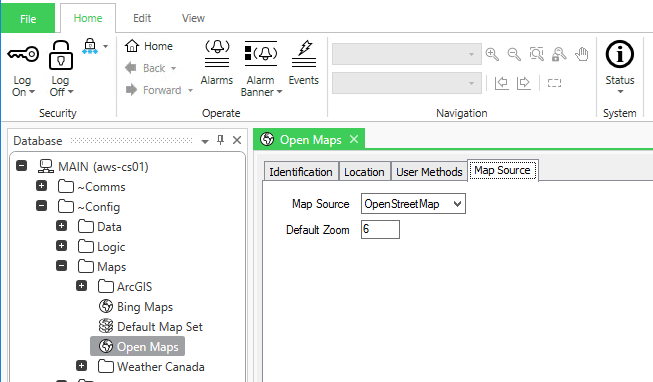
- This is what the Map Source properties will look like.
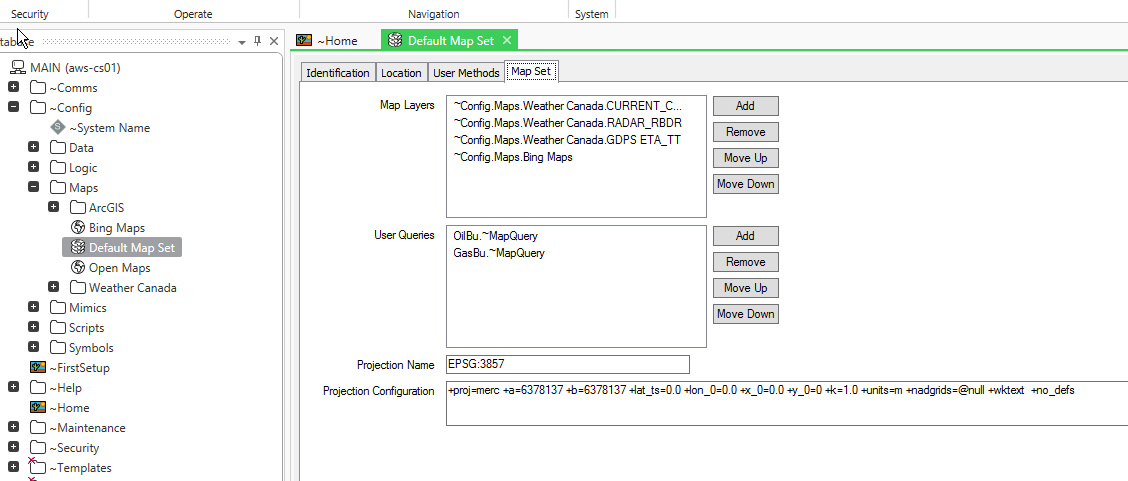
- Add a Map Set. Add your map source to the Map Set.
- Here are the map set properties.
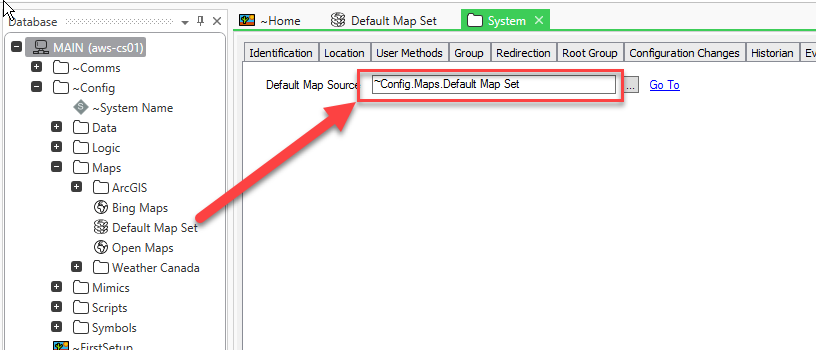
- Connect the Map Set to the system default map source.
- Now you can select any object in the database and pick “Display on Map”.
Getting Weather Maps
Weather Canada provides some publicly available weather data sets. Check out their Geospatial Web Services site for more info.
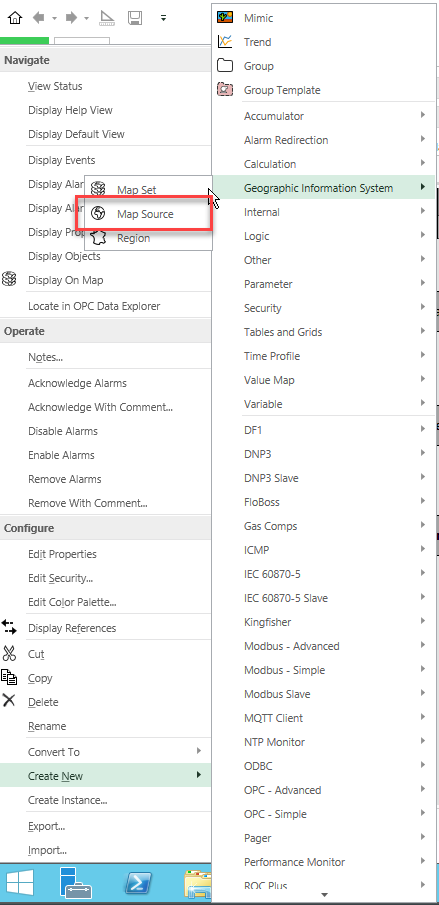
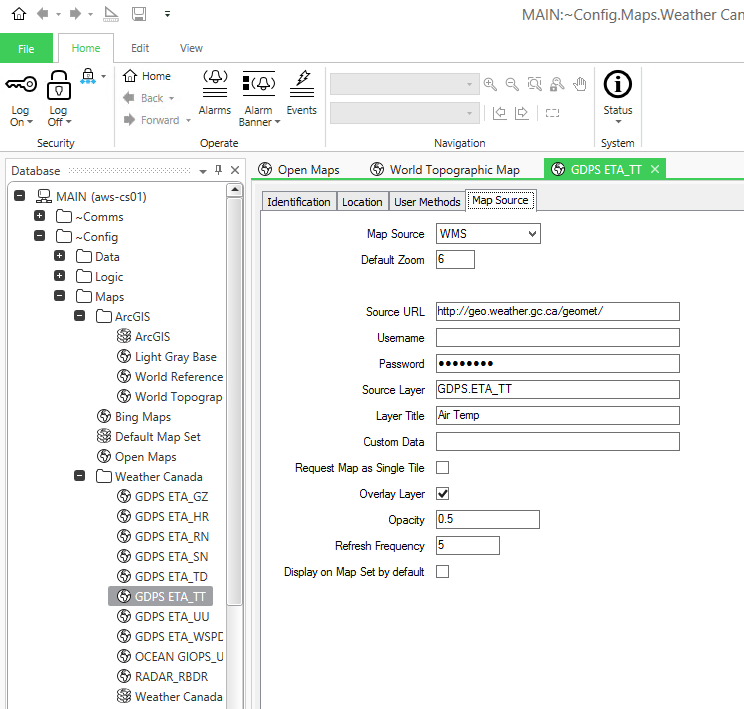
- Create a map source. Change its type to WMS. The source URL will be: http://geo.weather.gc.ca/geomet/. Set the Overlay Layer property to true. You do not need to enter a username or password. See below for a list of Source Layers.
- Add your map source to your map set.
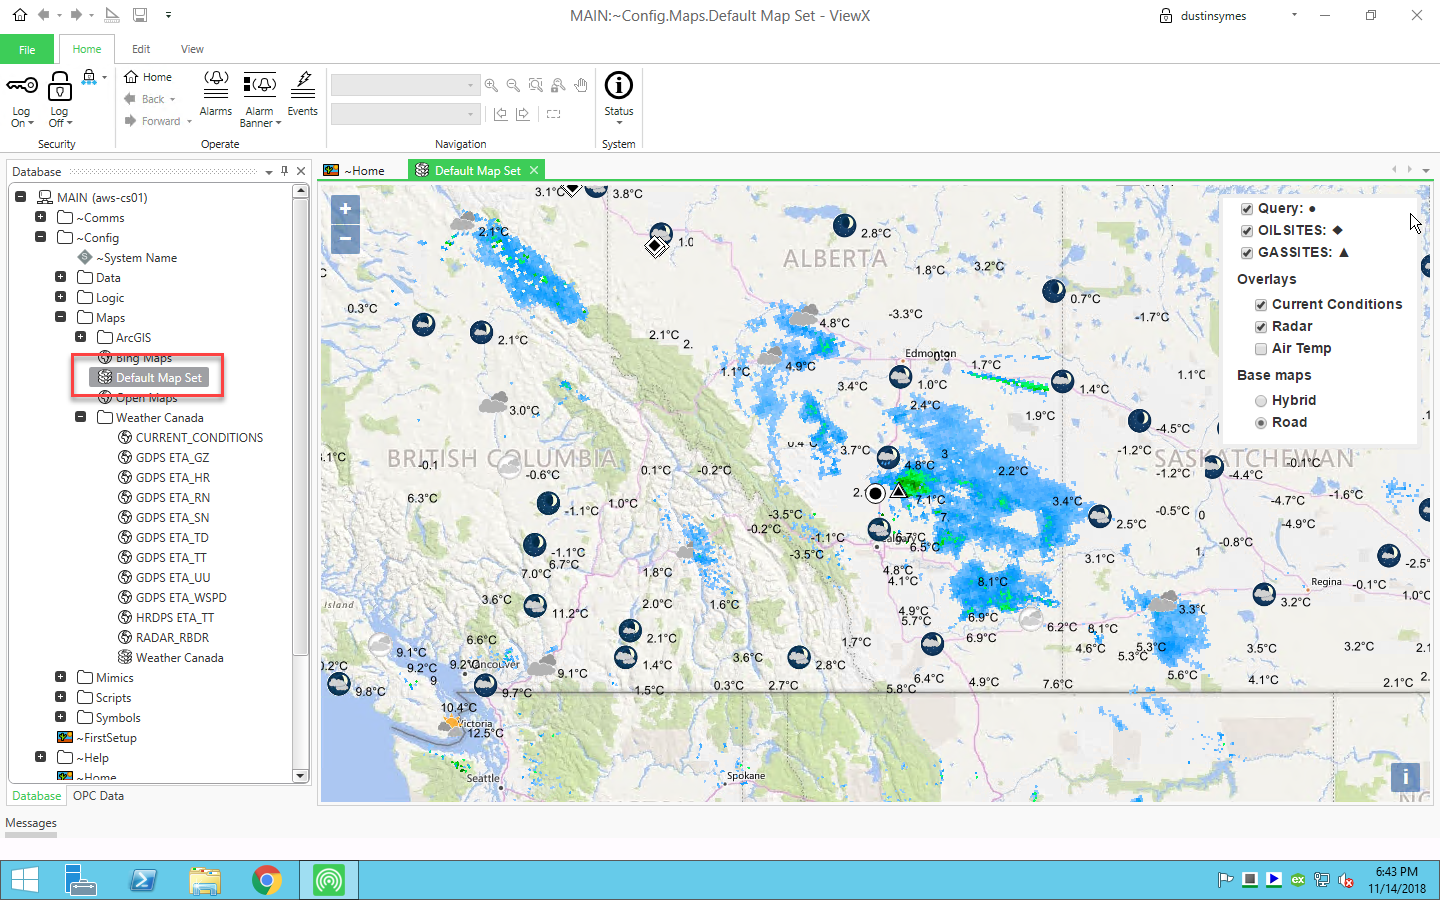
- Right-click on the map set and click on Display Map Set.
Weather Canada WMS Layers
Here are some common layer names that you can use for the Weather Canada map sources. Hint: Don’t include the description in parentheses.
CURRENT_CONDITIONS
GDPS.ETA_HR (relative humidity)
GDPS.ETA_RN (rain)
GDPS.ETA_SN (snow)
GDPS.ETA_TD (dewpoint temp)
GDPS.ETA_TT (current air temp)
GDPS.ETA_UU (wind, direction and speed)
GDPS.ETA_WSPD (windspeed)
RADAR_RDBR (weather radar, can show cloud cover)