
Data is driving a lot of business decisions these days. In Oil and Gas communication technology has caught up to the point where high resolution data is available. This enables a host of remote analysis and troubleshooting opportunities for engineers and operators. However, high resolution data is not available unless it is configured in the RTU systems. Field techs need to know how to do this basic configuration task.
Here are some instructions on how to configure a few extra historic points on a Floboss RTU. We are going to configure averaging history for casing pressure, tubing pressure, flow line pressure, well head temperature, gas flow rate, oil flow rate and water flow rate (assuming a three phase separator).
Open up ROCLink 800 Software. Connect to your RTU. Connecting to an RTU is outside the scope of this article.
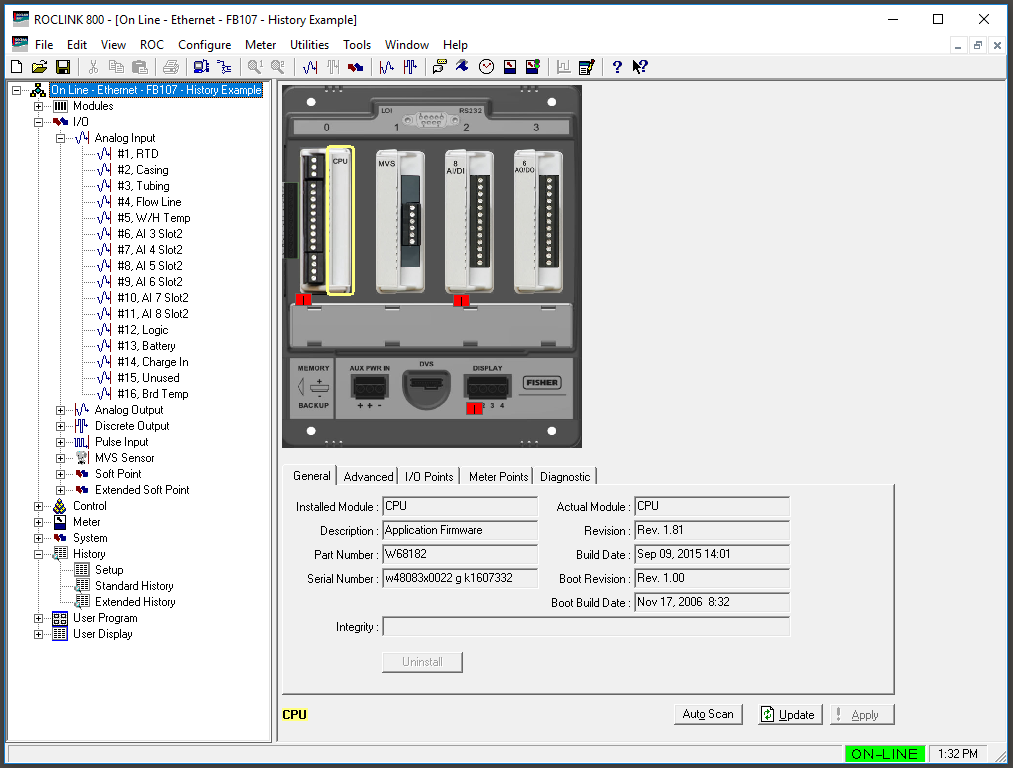
Now Double-Click on the “Setup” item under History. This opens the base configuration for the Floboss History. We want to make sure we have enough history points configured and that our retention time is long enough. Floboss RTUs can store one hour of minute logs, one day’s worth of hourly logs and 35 or 60 days of daily logs. All three time spans are recorded on all points configured in the standard history.
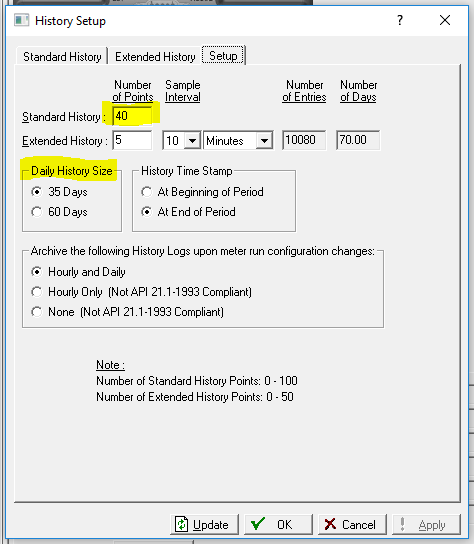
If you change the history setup you might need to reboot your RTU, so maybe ensure your site is in a safe state as the RTU outputs will turn off when it restarts.
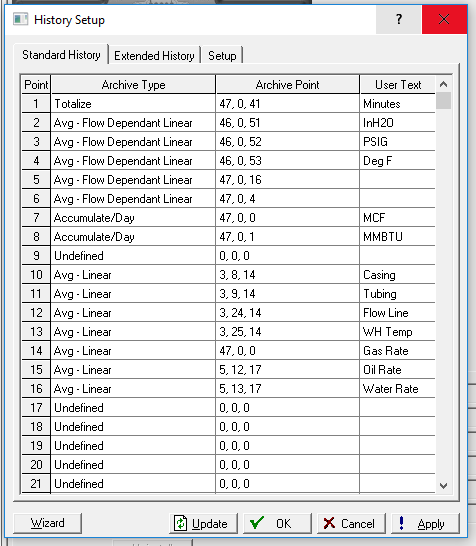
Now we can click over to the Standard History Configuration. Get to it through the ROCLink tree (if you closed the History Setup) or through the tab interface (if you left the window open). This is my configuration before any changes. Yours might be a little different. This is the most basic history required for EFM data collection.
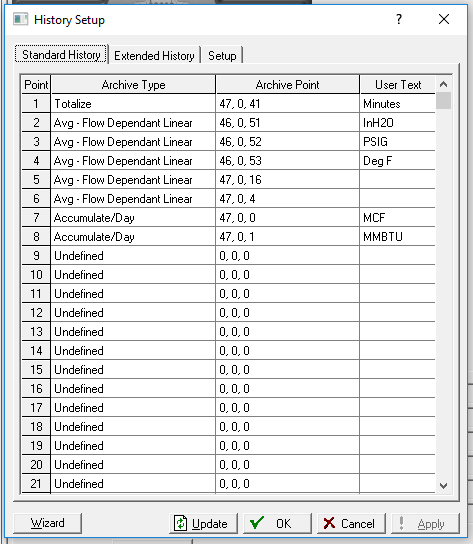
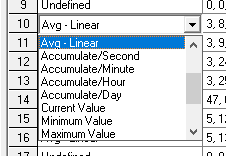
Now we are going to configure a few new history points. First pick your historic algorithm in the left column. There are a number of options. For our purposes we want a linear average (not flow weighted). This will provide consistent minute and daily averages for the flow rates and pressures.
Next choose the point you want to add to history. All my pressures are in analog points. The point window allows you to select any address available in the RTU.
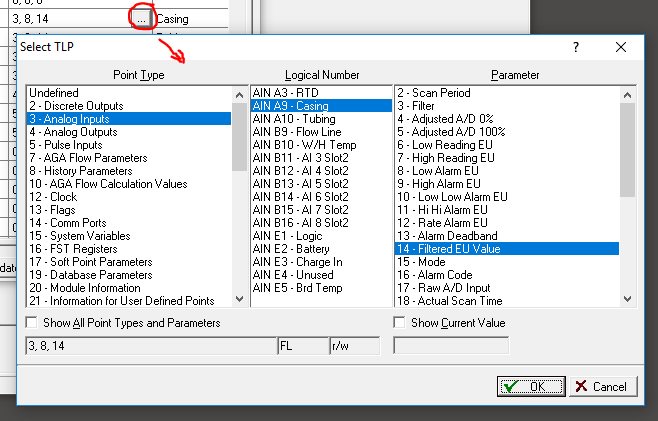
Lastly you should provide a short description so that others know what is being recorded. Make life easier for the next guy, it could be you!
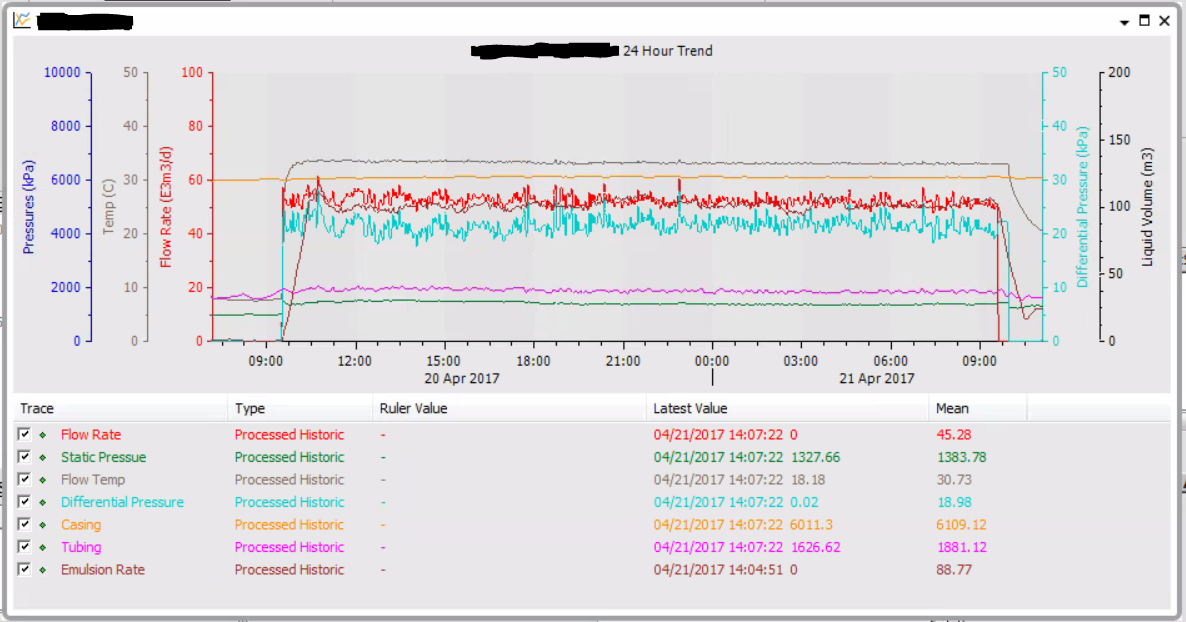
Now that this history is configured the Floboss RTU will record records as time passes. You can collect this history using ROCLink or a SCADA host if their polling drivers support historic points (ClearSCADA’s native driver works great for this!).
As you start using this data you will find new use cases. I had a client who recently used the high resolution minute flow rate averages to identify that a liquid dump valve on a separator had washed out. Daily pressure averages allow for accurate decline curves for reservoir teams and production engineers, as opposed to recording the instantaneous pressure each day.